Note
Go to the end to download the full example code.
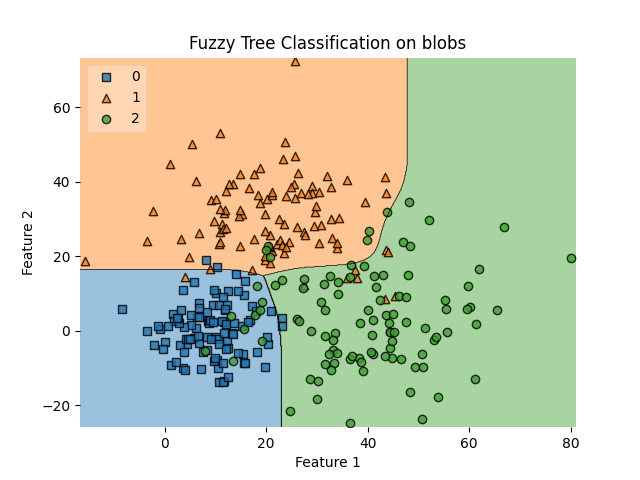
Plotting Fuzzy Decision Tree Classifier
An example plot of FuzzyDecisionTreeClassifier
from matplotlib import pyplot as plt
from mlxtend.plotting import plot_decision_regions
from sklearn.datasets import make_blobs

from fuzzytree import FuzzyDecisionTreeClassifier

X, y = make_blobs(
    n_samples=300,
    n_features=2,
    centers=[[10, 0], [20, 30], [40, 5]],
    cluster_std=[7, 11, 13],
    random_state=42,
)

clf = FuzzyDecisionTreeClassifier().fit(X, y)

plot_decision_regions(X=X, y=y, clf=clf, legend=2)
plt.title("Fuzzy Tree Classification on blobs")
plt.xlabel("Feature 1")
plt.ylabel("Feature 2")

plt.show()
Total running time of the script: (0 minutes 6.179 seconds)